How to size aftermarket revenue per installed machine (with formulas)
Aftermarket potential is what your installed base should consume, not what you sell today. A bottom-up model with formulas, a worked example and the checks that make the number credible.
Not ready to talk yet? Take the 3-minute Aftermarket Revenue Check
TL;DR
- Aftermarket potential is what your installed base should consume, not what you sell today.
- Build it bottom-up: active machines × operating hours × consumption per part × price.
- Compare it with actual parts and service revenue per machine. The gap is leakage plus untapped demand.
- You don’t need IoT data to start. Machine sales, service orders and parts orders are enough for a first model.
What does “aftermarket potential” actually mean?
Four terms, and it pays to keep them apart. Most internal debates about the aftermarket mix them up.
| Term | Definition | Where the data comes from |
|---|---|---|
| Installed base | Machines still in operation at customers | Machine sales, service visits, parts orders |
| Expected demand | Parts and service the installed base should consume per year | Maintenance plans, wear intervals, consumption rates |
| Captured revenue | Parts and service revenue you actually invoice | ERP billing (in SAP: VBRK / VBRP) |
| Wallet share | Captured revenue ÷ expected demand | Calculated |
Step 1: Which machines are still running?
Not every machine you ever sold is still in use. Count a machine as active if it had a service order or a parts order in the last 24 months. For the quiet ones, apply a survival rate by age cohort.
| Build years | Machines sold | Activity in last 24 months | Assumed active |
|---|---|---|---|
| 2019–2024 | 620 | 540 | 590 |
| 2014–2018 | 480 | 300 | 390 |
| 2009–2013 | 410 | 150 | 250 |
| before 2009 | 700 | 90 | 210 |
Illustrative numbers. The gap between “activity” and “assumed active” is your first finding: machines that run but don’t talk to you.
Step 2: How much should each machine consume?
Expected demand per machine and year =
  Σ wear parts:   (operating hours / replacement interval) × quantity × price
+ Σ consumables:  operating hours × consumption per hour × price
+ Σ service:      planned visits per year × average visit value
Worked example: machining centre, 4,000 hours a year
| Item | Interval / rate | Qty | Price | $ / year |
|---|---|---|---|---|
| Spindle bearing set | 16,000 h | 1 | $1,850 | $463 |
| Way wiper kit | 4,000 h | 1 | $240 | $240 |
| Coolant filter | 500 h | 2 | $38 | $608 |
| Hydraulic oil | 0.01 l / h | – | $6 / l | $240 |
| Annual inspection | 1 visit | – | $1,400 | $1,400 |
| Total | $2,951 |
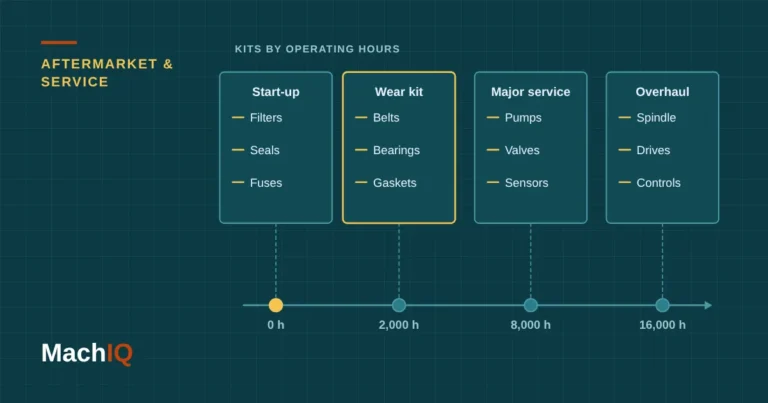
Intervals come from maintenance manuals, the service BOM, warranty data and your most experienced technicians. Start with the 50 parts that make up most of your parts revenue. The long tail can come later.
Step 3: Compare with what you actually sell
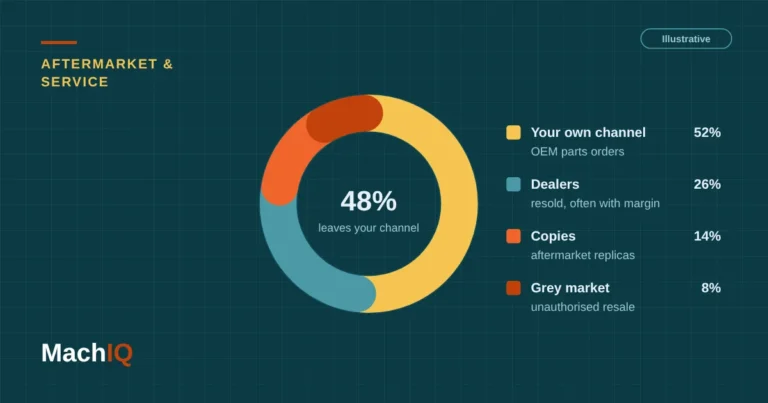
The shape is typical. Young machines buy from the OEM during warranty. Older machines drift to dealers, copy parts and local workshops. Simple wear parts leave first.
Step 4: Where does the gap go?
| Gap type | Signal in your data | What to do |
|---|---|---|
| Leakage to dealers or copy parts | Machine active (service visits) but few parts orders | Price check on top wear parts, kits, dealer programme |
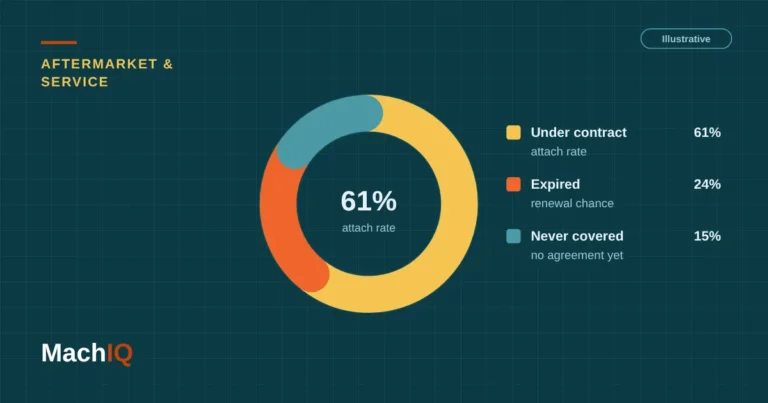
| Untapped demand | No service contract, no planned maintenance | Service contract offer, maintenance kits |
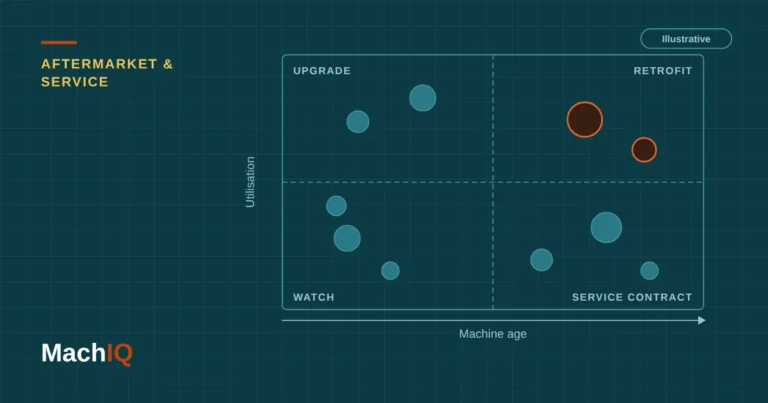
| Retrofit candidates | Old control, rising repair frequency | Modernisation offer |
| Lost machines | No activity for 3+ years | Find the owner via dealers and resale records |
Watch out
Don’t count a machine as lost just because it is quiet. Customers with good in-house maintenance often buy parts from you through a distributor. Check the distributor sales before you write the machine off.
Checklist: what data do you need?
- Machine sales with serial number, country and customer
- Parts and service orders with serial number or at least customer
- Service BOM with wear parts and kits
- Maintenance intervals for your top 50 parts
- Current price lists per country
FAQ
What is aftermarket wallet share?
Wallet share is the share of an installed machine’s parts and service spend that goes to the OEM. It is calculated as captured revenue divided by expected demand.
Do we need IoT data to size the aftermarket?
No. IoT data improves the estimate of operating hours, but machine sales, service orders and parts orders are enough for a first model. Operating hours can be estimated by industry and shift model.
How do we estimate operating hours without machine data?
Use shift models by customer industry: one shift is roughly 1,800 to 2,000 hours a year, two shifts roughly 3,600 to 4,000, three shifts 5,500 to 6,500. Calibrate with service reports where hours are recorded.
Why does wallet share drop with machine age?
After warranty, customers look for cheaper sources: dealers, copy parts and local workshops. Prices that are not competitive on simple wear parts speed this up.
How accurate is a bottom-up aftermarket model?
Accurate enough to rank regions, machine types and accounts. Treat the absolute number as a range and calibrate it with the machines whose full history you know.
Want the number for your installed base?
Send us a list of shipped machines and two years of parts orders under NDA. We’ll show you a first estimate of the gap.