Aftermarket KPIs: fill rate, attach rate and installed-base health on one page
Most aftermarket dashboards show revenue and order intake: what happened, but not why. Ten KPIs with definitions, data sources and a one-page layout management actually reads.
Not ready to talk yet? Take the 3-minute Data Foundation Check
TL;DR
- Track the aftermarket against the installed base, not only against last year. Revenue per active machine says more than total revenue.
- Ten KPIs in four groups are enough: growth, share, service quality, base health.
- Define every KPI in writing with formula and source. Most dashboard disputes are definition disputes.
- One page, monthly, with a trend line and an owner per KPI.
Which KPIs belong on the page?
| Group | KPI | Definition |
|---|---|---|
| Growth | Revenue per active machine | Parts + service revenue ÷ active installed base |
| Growth | Aftermarket share | Aftermarket revenue ÷ total revenue |
| Share | Wallet share | Captured ÷ expected parts and service demand |
| Share | Contract coverage | Active machines under contract ÷ active installed base |
| Share | Attach rate | New machines sold with contract ÷ machines sold |
| Service quality | Fill rate | Order lines delivered from stock ÷ order lines |
| Service quality | First-time fix rate | Visits solved in one visit ÷ visits |
| Service quality | Parts lead time | Order to delivery, median days |
| Base health | Active installed base | Machines with activity in 24 months |
| Base health | Machines on discontinued controls | Count and share of the active base |
What does the one-pager look like?
Eight tiles, each with the value and the change against last year. Behind each tile sits a 12-month trend and a drill-down by region and machine type. Red means the KPI moved the wrong way, not that it missed an arbitrary target.
Where does the data come from?
| KPI | Source |
|---|---|
| Revenue | ERP billing, split into parts, service and retrofit |
| Active installed base | Machine sales + service and parts activity |
| Expected demand | Aftermarket model (intervals, consumption) |
| Contracts | Contract management or CRM |
| Fill rate, lead time | ERP sales orders and deliveries |
| First-time fix | Field service system |
Agree definitions before you build
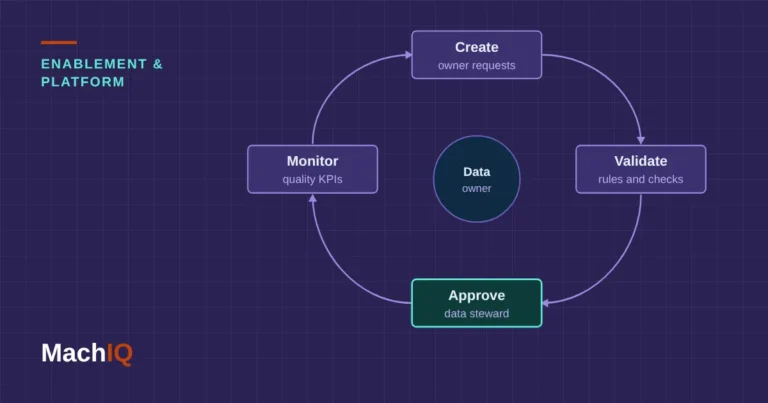
Write each KPI down with formula, source, filters and owner before anyone builds a chart. Otherwise the first management meeting is spent arguing about why finance and service show different numbers.
KPI          Fill rate
Formula      order lines delivered complete from stock ÷ all order lines
Scope        spare parts orders, all channels, excluding kits made to order
Source       ERP sales order items and deliveries
Frequency    monthly, 12-month trend
Owner        Head of Spare Parts Logistics
Target       95% overall, 98% for critical A-parts
How do you get it running?
Checklist
- A written definition for each KPI
- Active installed base per month
- Billing split into parts, service and retrofit
- An owner and target per KPI
- A monthly review slot with management
FAQ
Which KPIs matter most in the aftermarket?
Revenue per active machine, wallet share, service contract coverage, attach rate, fill rate, and the size and health of the active installed base.
Why measure revenue per active machine?
Total revenue grows with the installed base even if each machine buys less. Revenue per active machine shows whether you are capturing more of each machine’s demand.
What is fill rate?
The share of order lines delivered complete from stock. It is the most direct measure of spare parts availability for customers.
What is first-time fix rate?
The share of service visits where the problem is solved on the first visit, without a second visit for missing parts or skills.
How often should aftermarket KPIs be reviewed?
Monthly, with a 12-month trend. Weekly reviews only make sense for operational KPIs such as backlog and fill rate.
Want your aftermarket on one page?
Send us billing, machine and service data under NDA. We’ll build the first version of your KPI page with agreed definitions.